Financial Analysis
Using ratios to analyze performance—all while playing a game
To help you develop financial intuitions, we’re going to play a little game. This game will introduce the world of finance by creating an understanding of how to use numbers to evaluate performance—the critical process of financial analysis. Financial analysis answers some of the most fundamental questions that financial professionals—from CFOs and managers to investors and bankers—need to answer, questions that go to the root of a company’s performance, viability, and potential.
Financial analysis is much more than accounting. In this chapter, we won’t go through the mechanics of accounting (e.g., debits and credits) but rather develop intuition around financial ratios that use accounting. In using ratios during this game, you’ll understand that by comparing numbers in a common way, you can develop intuition for the sources of performance.
How safe is it to lend to a company? How financially rewarding is it to be a shareholder of a company? How much value does this company provide? Each of these questions cannot be answered by looking at any one number in isolation. Ratios provide a comparison of relevant numbers in a common way, which makes sense of otherwise meaningless numbers. In the context of this game, you will identify fourteen leading companies just on the basis of a series of ratios. After seeing how industries can be identified by ratios, you’ll use your newfound knowledge to analyze one company’s performance across time—and see how numbers can be used to create a narrative of the company’s fortunes and failures.
Let the games begin!
Making Sense of the Numbers
Take a look at Table 1-1, which is the backbone of this chapter. It provides a variety of ratios for fourteen real companies in 2013 that span different industries, organized by column. Notice that the companies have been anonymized by design. That constitutes the game: as you progress through this chapter, exploring the ratios, you’ll develop your financial intuition by matching each column of numbers to the corresponding company.
Table 1-1 is roughly organized into three horizontal sections. The first section represents the distribution of assets owned by a company, which includes its cash holdings, equipment, and inventory. The second section shows how these companies finance those assets, by either borrowing money and/or raising money from their owners or shareholders. The final section is a series of financial ratios that assess performance, which requires going beyond what a company owns and how they finance those purchases. Sometimes finance people seem to divide everything by everything, just to confuse us. But this isn’t the case. Ratios make interpretation possible because single numbers in isolation are meaningless (i.e., Is $100 million of income good or bad? You can only know by comparing that figure to revenue or something else).
The industries and associated companies represented are shown in Table 1-2. As you can see, these are leading companies from varied industries.
There are 406 different numbers in Table 1-1, which can be quite intimidating. Many may not make a lot of sense right now. Don’t panic. I’ll quickly explain what twenty-eight of the numbers mean—the “100s” across the rows for total assets and total liabilities and shareholders’ equity represent various totals for the first two sections. The companies aren’t the exact same size, but rather, the figures are percentages that represent the distribution of assets and financing sources. Accordingly, the numbers in those two sections add up to 100 when rounded.
TABLE 1-1
The unidentified industries game
| Balance sheet percentages | A | B | C | D | E | F | G |
| Assets | |||||||
| Cash and marketable securities | 35 | 4 | 27 | 25 | 20 | 54 | 64 |
| Accounts receivable | 10 | 4 | 21 | 7 | 16 | 12 | 5 |
| Inventories | 19 | 38 | 3 | 4 | 0 | 1 | 0 |
| Other current assets | 1 | 9 | 8 | 5 | 4 | 4 | 6 |
| Plant and equipment (net) | 22 | 16 | 4 | 8 | 46 | 7 | 16 |
| Other assets | 13 | 29 | 37 | 52 | 14 | 22 | 10 |
| Total assets* | 100 | 100 | 100 | 100 | 100 | 100 | 100 |
| Liabilities and shareholders’ equity | |||||||
| Notes payable | 0 | 0 | 8 | 3 | 5 | 2 | 0 |
| Accounts payable | 41 | 22 | 24 | 2 | 6 | 3 | 2 |
| Accrued items | 17 | 15 | 8 | 1 | 5 | 3 | 3 |
| Other current liabilities | 0 | 9 | 9 | 9 | 6 | 18 | 2 |
| Long-term debt | 9 | 2 | 11 | 17 | 29 | 9 | 10 |
| Other liabilities | 7 | 17 | 17 | 24 | 38 | 9 | 5 |
| Preferred stock | 0 | 15 | 0 | 0 | 0 | 0 | 0 |
| Shareholders’ equity | 25 | 19 | 23 | 44 | 12 | 55 | 78 |
| Total liabilities and shareholders’ equity* | 100 | 100 | 100 | 100 | 100 | 100 | 100 |
| Financial ratios | |||||||
| Current assets/current liabilities | 1.12 | 1.19 | 1.19 | 2.64 | 1.86 | 2.71 | 10.71 |
| Cash marketable securities and accounts receivable/current liabilities | 0.78 | 0.18 | 0.97 | 2.07 | 1.67 | 2.53 | 9.83 |
| Inventory turnover | 7.6 | 3.7 | 32.4 | 1.6 | NA | 10.4 | NA |
| Receivables collection period (days) | 20 | 8 | 63 | 77 | 41 | 82 | 52 |
| Total debt/total assets | 0.09 | 0.02 | 0.19 | 0.20 | 0.33 | 0.11 | 0.10 |
| Long-term debt/capitalization | 0.27 | 0.06 | 0.33 | 0.28 | 0.70 | 0.14 | 0.11 |
| Revenue/total assets | 1.877 | 1.832 | 1.198 | 0.317 | 1.393 | 0.547 | 0.337 |
| Net profit/revenue | -0.001 | -0.023 | 0.042 | 0.247 | 0.015 | 0.281 | 0.010 |
| Net profit/total assets | -0.001 | -0.042 | 0.050 | 0.078 | 0.021 | 0.153 | 0.004 |
| Total assets/shareholders’ equity | 3.97 | 2.90 | 4.44 | 2.27 | 8.21 | 1.80 | 1.28 |
| Net profit/shareholders’ equity | -0.005 | -0.122 | 0.222 | 0.178 | 0.171 | 0.277 | 0.005 |
| EBIT/interest expense | 7.35 | -6.21 | 11.16 | 12.26 | 3.42 | 63.06 | 10.55 |
| EBITDA/revenue | 0.05 | 0.00 | 0.07 | 0.45 | 0.06 | 0.40 | 0.23 |
*Column totals have been rounded to equal 100.
Source: Mihir A. Desai, William E. Fruhan, and Elizabeth A. Meyer, “The Case of the Unidentified Industries, 2013,” Case 214–
To help in your analysis, Table 1-3 provides a general representation of a balance sheet with the specific data for Starbucks—a global retail chain—in 2017. The “assets” side (or the left side) of the balance sheet seen in Table 1-3(b) enumerates what Starbucks owns, and the “liabilities and shareholders’ equity” side (or the right side) outlines how those assets are financed. On your personal balance sheet, your clothes, washing machine, television, automobile, or home are your assets. Any debt you might have is a liability, and the rest is your shareholders’ equity. Shareholders’ equity and net worth are interchangeable terms—we’ll use shareholders’ equity in what follows.
TABLE 1-2
Industries and companies to identify in the game
| Industry | Company |
|---|---|
| Airline | Southwest |
| Bookstore chain | Barnes & Noble |
| Commercial bank | Citigroup |
| Computer software developer | Microsoft |
| Department store chain with its “own brand” charge card | Nordstrom |
| Electric and gas utility with 80 percent of its revenue from electricity sales and 20 percent of its revenue from natural gas sales | Duke Energy |
| Online direct factory-to-customer personal computer vendor with more than half of its sales to business customers and most its manufacturing outsourced | Dell |
| Online retailer | Amazon |
| Parcel delivery service | UPS |
| Pharmaceutical company | Pfizer |
| Restaurant chain | Yum! |
| Retail drug chain | Walgreens |
| Retail grocery chain | Kroger |
| Social networking service |
To assess performance from the ratios in the third section, we’ll draw on income statements, which reflect the ongoing operations of a firm. Table 1-4 provides a general representation of an income statement with the specific data for Starbucks in 2017. Income statements show how a company realizes net profit after taking into account all its revenues and costs, much as you might consider your salary as revenue and your costs (e.g., food, housing, and so on) before you can figure out what you might be able to save.
TABLE 1-3
Representative balance sheets
| Assets: What a company owns | Liabilities and shareholders’ equity: how assets are financed |
|---|---|
| Current assets | Current liabilities |
| Cash | Accounts payable |
| Accounts receivable | Other current liabilities |
| Inventories | Noncurrent liabilities |
| Other current assets | Long-term debt |
| Noncurrent assets | Other liabilities |
| Property plant and equipment | |
| Intangibles and other assets | Shareholders’ equity |
| Retained earnings | |
| Other equity accounts | |
| Total assets | Total liabilities and shareholders’ equity |
(a) Balance sheet
| Assets | Liabilities and shareholders’ equity | ||
|---|---|---|---|
| Cash | 19% | Accounts payable | 5% |
| Accounts receivable | 6 | Other current liabilities | 15 |
| Inventories | 9 | Long-term debt | 36 |
| Other current assets | 2 | Other liabilities | 5 |
| Property plant and equipment | 34 | ||
| Intangibles and other assets | 29 | Total shareholders’ equity | 38 |
| Total assets* | 100 | Total liabilities and shareholders’ equity* | 100 |
*Totals have been rounded to equal 100.
(b) Balance sheet from Starbucks’ 2017 annual report
TABLE 1-4
Representative income statement from Starbucks’ 2017 annual report
| Income | |
|---|---|
| Revenue | 100% |
| Cost of goods sold | -40 |
| Gross profit | 60 |
| Selling general and administrative expenses | -42 |
| Operating profit (or earnings before interest and taxes EBIT) | 18 |
| Interest | -1 |
| Pretax income | 17 |
| Taxes | -6 |
| Net profit | 11% |
Much of finance involves looking at a bunch of numbers and coming up with interesting things to say about them. Knowing a little about the ratios in Table 1-1, what do you think about these numbers? You may be curious why some are so different from others. If so, excellent! The beginning of much financial analysis consists of looking at a series of numbers and thinking they are interesting. The best first step when looking at a sea of numbers is to look for extreme numbers and then create a story about these numbers. Before we figure out which company is which, let’s go through each section and identify some of the more extreme numbers. We will then explain what the numbers represent.
Assets
Because companies invest in assets in order to fulfill their mission, it is critical to develop an intuitive understanding of assets. In some sense, assets are the company itself. Häagen-Dazs, for example, owns the ice cream it’s going to sell, the factories to make that ice cream, and the trucks to deliver it. Assets are no more complicated than that. As seen in Table 1-5, assets are ordered by the degree to which they can be changed into cash; assets that can easily be changed into cash are called current assets and they appear at the top. What numbers strike you as particularly interesting in each row of Table 1-5?
Cash and marketable securities
Starting with the first row of Table 1-5, notice that companies F and G have more than half of their assets in cash and marketable securities. That should strike you as strange. Why would any company hold so much cash? This is a deep question in finance today as companies hold more cash than ever before—in aggregate, $2 to $3 trillion for US companies alone. As one example, Apple holds more than $250 billion in cash. We’ll return to this question in more detail later, but large cash holdings can generally be understood as (a) an insurance policy during uncertain times, (b) a war chest for making future acquisitions, or (c) a manifestation of the absence of investment opportunities.
TABLE 1-5
Assets for the unidentified industries game
Balance sheet percentages
| Asset Categories | A | B | C | D | E | F | G | H | I | J |
|---|---|---|---|---|---|---|---|---|---|---|
| Cash and marketable securities | 35 | 4 | 27 | 25 | 20 | 54 | 64 | 9 | 5 | 16 |
| Accounts receivable | 10 | 4 | 21 | 7 | 16 | 12 | 5 | 3 | 4 | 26 |
| Inventories | 19 | 38 | 3 | 4 | 0 | 1 | 0 | 3 | 21 | 17 |
| Other current assets | 1 | 9 | 8 | 5 | 4 | 4 | 6 | 6 | 2 | 4 |
| Plant and equipment (net) | 22 | 16 | 4 | 8 | 46 | 7 | 16 | 47 | 60 | 32 |
| Other assets | 13 | 29 | 37 | 52 | 14 | 22 | 10 | 32 | 7 | 5 |
| Total assets | 100 | 100 | 100 | 100 | 100 | 100 | 100 | 100 | 100 | 100 |
Column totals have been rounded to equal 100.
Given the forgone interest, it is unwise for companies to hold cash alone, so they invest much of their cash in government securities that can quickly be turned into cash—so-called marketable securities. Since marketable securities can be quickly converted into cash, they are often combined with cash in balance sheets.
Accounts receivable
Accounts receivable are amounts that a company expects to receive from its customers in the future. As trust grows in a relationship between a company and its customers, the company might be willing to allow customers to pay later. Many companies extend credit, allowing their customers, usually other businesses, to pay after thirty, sixty, or even ninety days. One company (N) has the majority of its assets in receivables. Why do you think that is? Why would companies B, H, and I have such few receivables?
Reflections
Consider three companies: Walmart (a multinational retail corporation), Staples (an office supplies chain), and Intel (a semiconductor chip manufacturer). Which one will have the highest amount of accounts receivable relative to its sales?
In 2016, Walmart had accounts receivable on its balance sheet of $5.6 billion, or 1.1 percent of sales. Staples had $1.4 billion in accounts receivable, or 6.7 percent of sales. And Intel had $4.8 billion, or 8.9 percent of sales. Companies like Intel that sell to other companies will have a higher amount of their sales reflected as receivables. Walmart has limited receivables because it largely deals with consumers. Staples represents an interesting middle case as it has both business-to-business and business- to-consumer businesses.
Inventories
Inventories are the goods (or the inputs that become those goods) that a company intends to sell. Inventories include raw materials, products that are being finished, and final goods. Häagen-Dazs’s inventories include all the ice cream it produces and the associated chocolate, dulce de leche, and coffee beans needed to make its ice cream.
Notice that some companies (E, G, M, and N) don’t have inventories. How could a company have nothing to sell? The answer is—and this is going to be the first clue for the overall exercise—that those companies likely provide services. Think of a law firm, an advertising company, or a medical practice—they don’t have physical goods they sell, so they are service providers.
Sure, I’ll continue from where we left off, focusing on the sections regarding Property, Plant and Equipment, and Other Assets:
Property, Plant, and Equipment (PP&E)
“Property, Plant, and Equipment” (PP&E) is the term for the tangible, long-term assets that a company uses to produce or distribute its product. This can include its headquarters, factories, machines in those factories, and stores. For example, a utility might have large hydroelectric dams and retail stores may have many outlets as part of their PP&E. Notice that companies I, L, and M have large shares in this category, higher than 60 percent. Which industries would those be?
Other Assets
In addition to the large amounts of cash for some companies, there are some companies, like company D, with large amounts in “other assets.” Indeed, the rising importance of both cash and other assets are two dominant trends in finance. But what does “other” mean? Other assets can mean many things, but are likely to be intangible assets—things you can’t put your hands on but are valuable nonetheless—things like patents and brands.
The one twist to this is that accountants don’t assign value to intangible assets unless they know those values precisely. So, for example, Coca-Cola has a very valuable brand, maybe the most valuable thing it owns, but it really doesn’t know exactly how valuable its brand is. So accountants ignore it. That’s the accounting principle of conservatism. The idea that we should ignore something just because we don’t know its precise value is also something that makes many people in finance distrust accounting.
When a company buys another company, many intangible assets that couldn’t previously be valued precisely now have a value according to accounting, because someone actually paid for it as part of an acquisition. This leads to one particularly important component of other assets: goodwill. When a company acquires another company for more than the value of its assets on their balance sheet, that difference is typically recorded on the acquiring company’s balance sheets as goodwill. As a consequence, companies with lots of other assets and goodwill are likely those that have bought other companies with many intangible assets that were previously unrecorded because of conservatism.
Reflections
Microsoft spent $26.2 billion in 2016 to acquire LinkedIn, which had assets with a book value of $7.0 billion. The $19.2 billion Microsoft paid above the book value will show up on Microsoft’s balance sheet as “other assets,” including goodwill. What did Microsoft pay for that was worth that additional $19.2 billion?
As one example, Microsoft could benefit from LinkedIn’s information on its 433 million users to optimize its marketing of enterprise solutions and productivity products. The value of the data on LinkedIn’s users never showed up on its balance sheet because of the difficulty in valuing it, but by purchasing LinkedIn, Microsoft made that value manifest.
This section ends the discussion about different asset types and leads into deeper financial insights and examples involving large transactions. If you need more of the document converted or have specific sections in mind, just let me know!
Continuing from where we left off:
Liabilities and Shareholders’ Equity
The second section, liabilities and shareholders’ equity, provides information on how companies finance themselves (see table 1-6). Essentially, there are only two sources of finance for purchasing assets—lenders and owners. Liabilities represent those amounts financed by lenders to whom the company owes amounts; shareholders’ equity, or net worth, corresponds to the funds that shareholders provide.
TABLE 1-6
Liabilities and shareholders’ equity for the unidentified industries game
| Balance sheet percentages | A | B | C | D | E | F | G | H | I |
|---|---|---|---|---|---|---|---|---|---|
| Notes payable | 0 | 0 | 8 | 3 | 5 | 2 | 0 | 0 | 11 |
| Accounts payable | 41 | 22 | 24 | 2 | 6 | 3 | 2 | 8 | 18 |
| Accrued items | 17 | 15 | 8 | 1 | 5 | 3 | 3 | 9 | 4 |
| Other current liabilities | 0 | 9 | 9 | 9 | 6 | 18 | 2 | 7 | 11 |
| Long-term debt | 9 | 2 | 11 | 17 | 29 | 9 | 10 | 33 | 25 |
| Other liabilities | 7 | 17 | 17 | 24 | 38 | 9 | 5 | 18 | 13 |
| Preferred stock | 0 | 15 | 0 | 0 | 0 | 0 | 0 | 0 | 0 |
| Shareholders’ equity | 25 | 19 | 23 | 44 | 12 | 55 | 78 | 25 | 17 |
| Total liabilities and shareholders’ equity | 100 | 100 | 100 | 100 | 100 | 100 | 100 | 100 | 100 |
Column totals have been rounded to equal 100.
You might notice parallels in your own life. Your debts (credit cards, mortgages, car loans, and student loans) have helped you finance your assets (a house, a car, and most important, your very valuable human capital). The difference between your assets and liabilities is your shareholders’ equity (or net worth).
As you’ll see in table 1-6, the patterns of financing are different across all the companies and industries. Company G, for example, uses a lot of shareholder equity as a source of financing. Others, like company N, use very little. That mix of financing is referred to as capital structure—a topic we’ll return to in chapter 4. Liabilities are ordered by the length of time companies have to repay them; and liabilities that need to be paid back soon are labeled “current.”
Accounts Payable and Notes Payable
Accounts payable represent amounts due to others, often over a short time, and typically to the company’s suppliers. One company’s accounts payable frequently correspond to another company’s accounts receivable. Company A owes a large amount of money to its suppliers. Why would that be? One possibility is that company A is in financial trouble and can’t pay its suppliers. Another possibility is that it willfully takes a long time to pay its suppliers. Which explanation is more plausible?
Sometimes firms may have notes payable, a short-term financial obligation. You’ll notice that company N is the only one that heavily uses notes payable. Company N also has far more receivables than the other companies, making it look altogether strange. Which company do you think would look so distinctive?
Reflections
Previously, we considered the accounts receivables positions of Walmart, Staples, and Intel. For each company, think about which customer might owe them money. In other words, which companies have accounts payable that correspond to the accounts receivables for these three companies?
Intel is the simplest example. It sells its chips to manufacturers of electronics with computing ability, so Lenovo or Dell would be its customers. So Intel’s accounts receivable correspond to the accounts payable of Lenovo or Dell.
Accrued Items
Accrued items broadly represent amounts due to others for activities already delivered. One example is salaries: a balance sheet may be produced in the middle of a pay period, and the company may owe salaries that have not been paid yet.
Long-term Debt
As we move from short-term liabilities to long-term liabilities in table 1-6, we encounter debt for the first time. Unlike the other liabilities, debt is distinctive because it has an explicit interest rate. You’ve likely encountered debt in your life. For example, students borrow money and, in doing so, take on debt to pay for college, just as homeowners borrow to buy homes. In table 1-6, you’ll see that some of the companies borrow a fair amount—30 percent to 40 percent of their assets have been financed with debt.
Preferred and Common Stock
Shareholders’ equity represents an ownership claim with variable returns—in effect, the owners get all residual cash from the business after costs and liabilities. Debt has a fixed return (i.e., interest rate) and no ownership claim, but it gets paid first before equity holders in the event of a bankruptcy. Equity holders have a variable return and an ownership claim but can be left with nothing if a company goes bankrupt. Typically, shareholders’ equity, net worth, owner’s equity, and common stock are all effectively synonyms. Shareholders’ equity is not only the amount originally invested in a company by the owners. As a company earns net profits, those profits can be paid out as dividends or reinvested in the company. These retained earnings are a component of shareholders’ equity because it is as if the owners received a dividend and reinvested it in the company—just as they did when they originally invested in the company.
Reflections
Take a look at the percentage of assets associated with long-term debt for company E (29 percent) and company I (25 percent). Which company’s debt do you think is riskier?
To answer this question, you should also consider the cash levels of the two companies—company E has 20 percent of its assets in cash while company I has only 5 percent of its assets in cash. Financial analysts sometimes think of cash as “negative debt” because it could be used to pay off debt immediately. In this case, company E can be considered to have net debt of 9 percent while company I has net debt of 20 percent. In this sense, company I would be riskier to lend additional amounts to relative to company E.
Only one company, company B, has preferred stock. Why is that? For that matter, what is that? How could one type of owner be preferred?
Preferred stock is often called a hybrid instrument because it combines elements of both debt and equity claims. Like debt, a preferred dividend can be fixed and paid before common stock dividends, but like equity, preferred stock is associated with ownership and is paid after debt in the event of a bankruptcy. Preferred stock is, unsurprisingly, preferred: when the world goes bad, preferred stockholders get paid before common stockholders, and when things go well, they get to benefit from the upside, unlike debt holders, as shareholders.
Why Would a Company Issue Such a Security? Imagine a company that has hit hard times and faces a risky future. Would you want to invest in their common stock if failure was a real possibility? And would you want to lend to it and only get a fixed return that might not correspond to the riskiness of the business? The unique attributes of preferred stock can allow a company to finance itself during precarious times.
Reflections
Venture capital firms, which provide funding for entrepreneurial ventures, almost always receive preferred stock in exchange for their funding. Why do they prefer this form of financing?
Preferred stock allows them to protect their investment in the event that the company does poorly, while still participating in the upside if the company does well. They do this by converting their preferred stock into regular common stock when things go well.
Understanding Ratios
Now that we’ve had a chance to think about how companies are represented by their balance sheets, let’s get to something even more meaningful in terms of analyzing a company—financial ratios. Ratios are the language of business, and finance people love to create them, talk about them, flip them upside down, break them apart, and so on.
Ratios make numbers meaningful by providing comparability across companies and through time. For example, Coca-Cola’s net profit for 2016 was $7.3 billion. Is that a lot of money for the company? It’s hard to tell without context. Alternatively, knowing that Coca-Cola’s net profit was 16 percent of its revenue (net profit divided by revenue) is much more helpful. Likewise, knowing that Coca-Cola has $64 billion in liabilities may not mean very much; knowing that 71 percent of its assets are financed with liabilities (liabilities divided by assets) tells us a lot more about that company. You can also compare those ratios to other companies’ ratios and to previous performance.
Broadly Speaking, the Ratios in Table 1-7 Deal With Four Questions:
- How is the company doing in terms of generating profits?
- How efficient or productive is the company?
- How does it finance itself?
- The final question revolves around liquidity, which refers to the ability of a company to generate cash quickly. If all your assets are in real estate, you are illiquid. And if all your wealth is in your checking account, you’re highly liquid.
Liquidity
Most companies go bankrupt because they run out of cash. Liquidity ratios measure this risk by emphasizing the company’s ability to meet short-term obligations with assets that can quickly be converted into cash.
Suppliers like to see high liquidity ratios because they want to ensure that their customers can pay them. For shareholders, greater liquidity creates a trade-off. Yes, they want to ensure that the company doesn’t go bankrupt. But highly liquid assets, like cash and marketable securities, may not provide much of a return.
Current Ratio
(Current assets) / (current liabilities)
The current ratio asks a question on behalf of a company’s suppliers: Will this company be able to pay its suppliers if it needs to close? Will its current assets be sufficient to pay off its current liabilities (including those owed to suppliers)? This ratio is a key way to think about if a supplier should extend credit to a company and if a company will be able to survive the next six or twelve months.
Quick Ratio
(Current assets - inventory) / (current liabilities)
TABLE 1-7
Ratios for the unidentified industries game
| Financial Ratios | A | B | C | D | E | F | G |
|---|---|---|---|---|---|---|---|
| Current assets/current liabilities | 1.12 | 1.19 | 1.19 | 2.64 | 1.86 | 2.71 | 10.71 |
| Cash, marketable securities, and accounts receivable/current liabilities | 0.78 | 0.18 | 0.97 | 2.07 | 1.67 | 2.53 | 9.83 |
| Inventory turnover | 7.6 | 3.7 | 32.4 | 1.6 | NA | 10.4 | NA |
| Receivables collection period (days) | 20 | 8 | 63 | 77 | 41 | 82 | 52 |
| Total debt/total assets | 0.09 | 0.02 | 0.19 | 0.20 | 0.33 | 0.11 | 0.10 |
| Long-term debt/capitalization | 0.27 | 0.06 | 0.33 | 0.28 | 0.70 | 0.14 | 0.11 |
| Revenue/total assets | 1.877 | 1.832 | 1.198 | 0.317 | 1.393 | 0.547 | 0.337 |
| Net profit/revenue | -0.001 | -0.023 | 0.042 | 0.247 | 0.015 | 0.281 | 0.010 |
| Net profit/total assets | -0.001 | -0.042 | 0.050 | 0.078 | 0.021 | 0.153 | 0.004 |
| Total assets/shareholders’ equity | 3.97 | 2.90 | 4.44 | 2.27 | 8.21 | 1.80 | 1.28 |
| Net profit/shareholders’ equity | -0.005 | -0.122 | 0.222 | 0.178 | 0.171 | 0.277 | 0.005 |
| EBIT/interest expense | 7.35 | -6.21 | 11.16 | 12.26 | 3.42 | 63.06 | 10.55 |
| EBITDA/revenue | 0.05 | 0.00 | 0.07 | 0.45 | 0.06 | 0.40 | 0.23 |
Reflections
Let’s think about three different companies: Rio Tinto Group, a global mining and metals corporation; NuCor Corporation, a mini-mill steel producer; and Burberry, a luxury fashion house. For each, which ratio would you prefer to see— the quick ratio or the current ratio?
This question hinges on which company you think has the riskiest inventory. In many ways, Burberry is likely to have the riskiest inventory because there is no spot market available for it to liquidate its inventory. If it makes a stylistic mistake on a new product, it may find it impossible to sell that inventory, even at a discount. By contrast, Rio Tinto—and NuCor, to a lesser degree—may be more able to dispose of their inventory quickly because they deal in materials that have a spot market.
The quick ratio resembles the current ratio, but excludes inventories from the numerator. Why make a big deal out of inventories? You might think inventories are about operations, but to finance people, inventories represent risk that needs to be financed. And inventory can be very risky. Think about BlackBerry, which competed in the smartphone market where products quickly grow obsolete. In 2013, the company released the Z10 late and was forced to declare that $1 billion of inventory was, in fact, worth zero. For companies with high-risk inventory, the quick ratio provides a more skeptical view of their liquidity.
Profitability
Profitability can be assessed in a number of different ways because the appropriate measure depends on the specific question being asked. And profitability can also be assessed without traditional accounting-based profit measures.
As always, it’s important to compare profits to something. For example, you could look at net profit, or the income after all costs and expenses, and compare it to sales (to represent the margin) or to shareholders’ equity (to represent the return to a shareholder). Both are key measures of profitability. One measure asks: For every dollar of revenue, how much money does a firm get to keep after all relevant costs? The other, when you divide profits by shareholders’ equity, asks: For every dollar a shareholder puts into a company, how much do they get back every year? That’s the notion of a return, specifically a return on equity.
Profit Margin
Net profit / revenue
As seen in table 1-1, there are several different measures of profits that consider different sets of costs. Gross profit only subtracts the expenses related to the production of goods from revenue, while operating profit also subtracts other operating costs, such as selling and administrative costs. Finally, net profit also subtracts interest and tax expenses from operating profit. Interestingly, companies A and B have negative profit margins, while companies D and F have profit margins of approximately 25 percent.
Return on Equity (ROE)
Net profit / shareholders’ equity
This ratio, often called return on equity (ROE), measures the annual return that shareholders earn. In particular, for every dollar of equity that shareholders invest in a business, what is their annual flow of income? As two examples, company C has an ROE of 22 percent, while company M has an ROE of only 6 percent.
Return on Assets
Net profit / total assets
Often called return on assets, this ratio asks: How much profit does a company generate for every dollar of assets? This corresponds to asking how effectively a company’s assets are generating profits.
EBITDA Margin
EBITDA / revenue
EBITDA is one of the all-time great finance acronyms and is best said quickly—“E-BIT-DA.” It’s also an indication that we’re moving away from the accounting idea of profits and toward the emphasis on cash in finance. What is EBITDA? Let’s begin by breaking it into two parts—EBIT and DA.
EBIT is just a fancy finance term for something you already know as operating profit. If you work up from the bottom of the profit statement, you can recharacterize operating profit as “earnings before interest and taxes,” or EBIT. Since some companies have different tax burdens and capital structures, EBIT provides a way to compare their performances more directly. For example, an American publisher and a German publisher might face different tax rates. Net profit, which factors in taxes, would provide a distorted view; EBIT, which excludes tax charges, would not.
What about DA? DA stands for “depreciation and amortization.” Depreciation refers to how physical assets, such as vehicles and equipment, lose value over time, and amortization refers to that same phenomenon but for intangible assets. The reason to emphasize DA is because they are expenses that are not associated with the outlay of cash; it is just an approximation of the loss of value of an asset. Suppose you build a factory. In accounting, you have to depreciate it and charge yourself an expense for that depreciation. But in finance, we emphasize cash and there was no cash outlay, so EBITDA—or earnings before interest, taxes, depreciation, and amortization—is a measure of the cash generated by operations. Because DA was subtracted to arrive at EBIT, DA needs to be added back to get to EBITDA.
As we’ll see in chapter 2, the emphasis on cash is a linchpin of the finance perspective. One example I’ll develop more fully later, Amazon, has little profitability but significant EBITDA. Among the companies in table 1-7, it’s notable that company D generates a remarkable amount of cash—45 percent, or 45 cents for every dollar of revenue! Similarly, company L has a reasonable profit margin of 9 percent, but a whopping EBITDA margin of 28 percent. Why would that be?
Financing and Leverage
Leverage is one of the most powerful concepts in finance, and it corresponds roughly to our previous discussions of financing choices and capital structure. You may have friends in finance who get weepy-eyed when they talk about leverage. Empires have been built and destroyed because of leverage, and you’ll see why.
Why is it called “leverage”? The easiest way to understand the power of leverage is to recall the power of a lever in an engineering context. Imagine a big rock that you can’t possibly move by yourself. A lever will allow you to move that rock, seemingly magically, by multiplying the force you apply to the task. And that’s a precise analogue for what happens with leverage in finance. Just as a lever lets you move a rock you couldn’t otherwise move, leverage in finance allows owners to control assets they couldn’t control otherwise.
Let’s consider your own personal balance sheet after you buy a home. What if no mortgages were available for you to buy a home? If you had $100, you could only buy a home that was worth $100. With a mortgage market, you can borrow money to buy a home that is worth, say, $500. Let’s see what your balance sheet looks like under those two circumstances.
TABLE 1-8
Balance sheets for home purchases
| Case A | Case B | ||
|---|---|---|---|
| Assets | Liabilitiesand share‐holders’equity | Assets | Liabilitiesand share‐holders’equity |
| $100 home | $100 net worth | $500 home | $400 mortgage, $100 equity |
In effect, leverage allows you to live in a house you have no right to live in. It almost as magical as the lever helping you move a rock.
Here’s the big question: Are you richer in case A or case B? Some think you’re richer in case A because you don’t owe anything. Some think you’re richer in case B because you live in a larger home. In fact, your wealth is no different; in both cases, you have $100 of shareholders’ equity.
Leverage not only allows you to control assets you have no right to control, but it also increases your returns. Imagine that the house increases in value by 10 percent in the two cases. In case A, the return to your shareholders’ equity is 10 percent, but in case B, your return is 50 percent if the house value increases to $550, but the mortgage remains at $400.
Real-World Perspectives
Alan Jones, global head of private equity for Morgan Stanley, commented on private equity’s use of leverage:
“The home mortgage analogy is really quite apt. Say we are buying a company that is worth $100. We can buy that company outright with either $100 of equity or with $70 of debt that we borrow from someone else and $30 of our own capital. If the value of that asset doubles during our ownership, in the first instance, our return is that incremental $100, or about a 100 percent return over whatever time we’ve held it. But if we bought that same asset using $70 of other people’s money (i.e., debt), we’ve got equity that’s now worth $130 versus the $30 that we originally invested. So instead of just doubling our money, we’ve gotten a return of more than four times on our money. As a result, people are attracted to get as much of ‘other people’s money’ as they can.”
Unfortunately, it’s not all milk and honey. If the house declines in value by 20 percent, the return to your shareholders’ equity is -20 percent in case A, but in case B, your return is -100 percent! So managing leverage is critical because it enables you to do things you couldn’t otherwise do and because it magnifies your returns—in both directions.
Debt to Assets
Total debt / total assets
The ratio of total debt to total assets measures the proportion of all assets financed by debt. It provides a balance sheet perspective on leverage.
Debt to Capitalization
Debt / (debt + shareholders’ equity)
The ratio of long-term debt to capitalization provides a somewhat more subtle measure of leverage by emphasizing the mix of debt and equity. The denominator in this ratio is capitalization—the combination of a company’s debt and equity. As we saw, there are two primary types of financing for a company, and we think about them differently. Debt has a fixed interest cost associated with it, while equity holds a variable rate of return—which means it fluctuates—along with ownership rights. This ratio tracks what proportion of a company’s financing comes from debt and therefore diverts attention from liabilities that are part of operations.
Assets to Shareholders’ Equity
Assets / shareholders’ equity
Leverage provides the ability to control more assets than an owner would otherwise have the right to control. This ratio tells us precisely how many more assets an owner can control relative to their own equity capital. As a consequence, it also measures how returns are magnified through the use of leverage.
Interest Coverage Ratio
EBIT / interest expense
The three previous measures were constructed from balance sheets, but the critical question is often the degree to which a company can make its interest payments. The ratio of EBIT to interest expense measures a company’s ability to fund interest payments from its operations and uses only data from the income statement.
Reflections
Over the past two decades, pharmaceutical companies have been slowly increasing their leverage. For example, in 2001, Merck had a debt-to-equity ratio of 0.53; Pfizer’s was 1.14. In 2016, Merck’s debt-to-equity ratio was 1.28; Pfizer’s was 1.58. What was going on in this industry to cause this shift?
One possible explanation for this change is that pharmaceutical companies are generating more stable cash flows that can service larger debt amounts. Large pharmaceutical companies increasingly purchase promising technologies from biotechnology companies rather than undertaking the risky process of developing new treatments and medicines themselves. As a result, large pharmaceutical companies’ overall risk has decreased, and lenders have been more willing to extend credit to them.
Private equity companies sometimes use debt in transactions known as LBOs—leveraged buyouts—to purchase companies. In these transactions, the company borrows to buy out many shareholders, leaving it much more highly levered than previously. What sorts of industries would you expect to be the targets of LBOs?
In short, companies with stable business models and committed customers are good candidates for LBOs. If the business has stable cash flows, it is able to sustain higher leverage in a more secure way than companies with very risky technologies. Classic LBO targets include tobacco companies, gaming companies, and utilities because of their committed customers and predictable demand with little threat of substitution.
As one example, a ratio of 1 indicates that a company is just able to make its interest payments with its current operations. In your own life, consider the comparison between your monthly income and any mortgage payments as an analogous measure.
A hybrid measure using elements from both the income statement and the balance sheet—debt/EBITDA—is a way to combine information from the balance sheet and the income statement.
Productivity or Efficiency
Productivity is a popular buzzword, but what does it mean from a finance perspective? In short, increases in productivity mean you can squeeze more from less. More narrowly, productivity ratios measure how well a company utilizes its assets to produce output. Over the long run, increases in productivity are the most important contributor to economic growth.
Reflections
The effect of information technology over the past several decades is an important example of productivity increases. For example, retailers and wholesalers, and Walmart in particular, contributed significantly to the aggregate productivity gains of the 1990s in the United States. According to the McKinsey Global Institute, “Wal-Mart directly and indirectly caused the bulk of the productivity acceleration through ongoing managerial innovation that increased competitive intensity and drove the diffusion of best practice” in retail. How were these gains manifest in the economy?
These gains could be manifest in rising wages, returns to capital providers, and lower prices for consumers. While many commentators have bemoaned the absence of wage gains from rising productivity, these productivity gains have reduced consumer prices significantly, and lower-income individuals have benefited from those reduced prices. So productivity gains may not have reduced income inequality, but they did reduce consumption inequality.
Asset Turnover
Revenue / total assets
This ratio measures how effectively a company is using its assets to generate revenue. This is a critical measure of a company’s productivity.
Inventory Turnover
Cost of goods sold / inventory
Inventory turnover measures how many times a company turns over or sells all its inventory in a given year. The higher the number, the more effectively the company is managing its inventory as it sells products. Because inventory is essentially a risky asset that needs to be financed, a higher inventory turnover is financially valuable.
We can use this turnover number to get another measure of inventory management: days of inventory.
Days Inventory
365 ÷ inventory turnover
Dividing the number of days in a year (365) by the inventory turnover provides the average number of days a piece of inventory is kept inside a company before it is sold. Take a look at company C in table 1-1. It turns over its inventory more than thirty times a year, which corresponds to keeping inventory around for slightly more than ten days. In contrast, company B has an inventory turnover of only four times a year, which means that inventory is sticking around for almost a hundred days!
Receivables Collection Period
365 ÷ (inventory turnover / receivables)
After a company sells its inventory, it needs to get paid for it. The lower this figure, the faster a company is getting cash from its sales. As you can see, company N looks pretty strange—it collects cash from its customers after more than twenty years! What could give rise to such a situation?
Do you notice anything about the numbers for the other companies? The remaining companies can be roughly divided into one group that collects very quickly (fewer than thirty days) and another group that collects more slowly. That difference will be a significant clue for what types of companies they are.
Let the Games Begin
Now that you have a better understanding of all the numbers, try to puzzle your way through which numbers correspond to which company. You’ll learn more by trying to arrive at the solution yourself than simply reading ahead.
To get started, see table 1-9, where some of the more notable numbers from our previous discussion are highlighted. Rather than trying to identify all fourteen companies at once, let’s focus on two subsets—service companies and retailers—that we can clearly identify, and then we’ll look at the rest.
Service Companies
Looking at the ratios, service companies are relatively easy to spot. Since they provide services rather than tangible goods, they don’t hold inventories—which points to companies E, G, M, and N. So which four companies can we match to E, G, M, and N? Two of the companies have “service” in their name: the parcel delivery service, which is UPS, and the social networking service, which is Facebook. What about the other two? Banks are service providers and so are airlines, so the other two companies are Southwest Airlines and Citigroup. The airline is somewhat tricky because you might have thought that those planes and spare parts are inventory. But the airlines’ primary line of business does not involve selling planes or spare parts—they transport people, and that’s clearly a service with no notion of inventory.
TABLE 1-9
The unidentified industries game
| Balance sheet percentages | A | B | C | D | E | F | G |
|---|---|---|---|---|---|---|---|
| Cash and marketable securities | 35 | 4 | 27 | 25 | 20 | 54 | 64 |
| Accounts receivable | 10 | 4 | 21 | 7 | 16 | 12 | 5 |
| Inventories | 19 | 38 | 3 | 4 | 0 | 1 | 0 |
| Other current assets | 1 | 9 | 8 | 5 | 4 | 4 | 6 |
| Plant and equipment (net) | 22 | 16 | 4 | 8 | 46 | 7 | 16 |
| Other assets | 13 | 29 | 37 | 52 | 14 | 22 | 10 |
| Total assets | 100 | 100 | 100 | 100 | 100 | 100 | 100 |
| Liabilities and shareholders’ equity | A | B | C | D | E | F | G |
|---|---|---|---|---|---|---|---|
| Notes payable | 0 | 0 | 8 | 3 | 5 | 2 | 0 |
| Accounts payable | 41 | 22 | 24 | 2 | 6 | 3 | 2 |
| Accrued items | 17 | 15 | 8 | 1 | 5 | 3 | 3 |
| Other current liabilities | 0 | 9 | 9 | 9 | 6 | 18 | 2 |
| Long-term debt | 9 | 2 | 11 | 17 | 29 | 9 | 10 |
| Other liabilities | 7 | 17 | 17 | 24 | 38 | 9 | 5 |
| Preferred stock | 0 | 15 | 0 | 0 | 0 | 0 | 0 |
| Shareholders’ equity | 25 | 19 | 23 | 44 | 12 | 55 | 78 |
| Total liabilities and shareholders’ equity | 100 | 100 | 100 | 100 | 100 | 100 | 100 |
| Financial Ratios | A | B | C | D | E | F | G |
|---|---|---|---|---|---|---|---|
| Current assets/current liabilities | 1.12 | 1.19 | 1.19 | 2.64 | 1.86 | 2.71 | 10.71 |
| Cash, marketable securities, and accounts receivable/current liabilities | 0.78 | 0.18 | 0.97 | 2.07 | 1.67 | 2.53 | 9.83 |
| Inventory turnover | 7.6 | 3.7 | 32.4 | 1.6 | NA | 10.4 | NA |
| Receivables collection period (days) | 20 | 8 | 63 | 77 | 41 | 82 | 52 |
| Total debt/total assets | 0.09 | 0.02 | 0.19 | 0.20 | 0.33 | 0.11 | 0.10 |
| Long-term debt/capitalization | 0.27 | 0.06 | 0.33 | 0.28 | 0.70 | 0.14 | 0.11 |
| Revenue/total assets | 1.877 | 1.832 | 1.198 | 0.317 | 1.393 | 0.547 | 0.337 |
| Net profit/revenue | -0.001 | -0.023 | 0.042 | 0.247 | 0.015 | 0.281 | 0.010 |
| Net profit/total assets | -0.001 | -0.042 | 0.050 | 0.078 | 0.021 | 0.153 | 0.004 |
| Total assets/shareholders’ equity | 3.97 | 2.90 | 4.44 | 2.27 | 8.21 | 1.80 | 1.28 |
| Net profit/shareholders’ equity | -0.005 | -0.122 | 0.222 | 0.178 | 0.171 | 0.277 | 0.005 |
| EBIT/interest expense | 7.35 | -6.21 | 11.16 | 12.26 | 3.42 | 63.06 | 10.55 |
| EBITDA/revenue | 0.05 | 0.00 | 0.07 | 0.45 | 0.06 | 0.40 | 0.23 |
Column totals have been rounded to equal 100.
Let’s try to figure out which column in table 1-10 corresponds to which company by beginning with some low-hanging fruit.
Company N: The outlier
Which company owns receivables that take a long time to collect, and a large fraction of their financing comes from notes payable? Who could expect to collect from customers in twenty years on average?
The answer is a bank. Banks are difficult to relate to because their balance sheets are mirrors of our own. The loans that you consider your liabilities are a bank’s assets. So the mortgage from the housing example is an asset for a bank. And the deposits that you consider your assets are the bank’s liabilities—its notes payable. Citigroup has the highest amount of leverage in the group, a characteristic that is true of the banking industry in general.
Table 1-10: Identifying the service companies
| Balance sheet percentages | E | G | M | N |
|---|---|---|---|---|
| Assets | ||||
| Cash and marketable securities | 20 | 64 | 16 | 7 |
| Accounts receivable | 16 | 5 | 2 | 83 |
| Inventories | 0 | 0 | 0 | 0 |
| Other current assets | 4 | 6 | 5 | 0 |
| Plant and equipment (net) | 46 | 16 | 69 | 0 |
| Other assets | 14 | 10 | 9 | 10 |
| Total assets | 100 | 100 | 100 | 100 |
| Liabilities and Shareholders’ Equity | ||||
| Notes payable | 5 | 0 | 1 | 50 |
| Accounts payable | 6 | 2 | 6 | 21 |
| Accrued items | 5 | 3 | 6 | 0 |
| Other current liabilities | 6 | 2 | 12 | 3 |
| Long-term debt | 29 | 10 | 16 | 13 |
| Other liabilities | 38 | 5 | 22 | 4 |
| Preferred stock | 0 | 0 | 0 | 0 |
| Shareholders’ equity | 12 | 78 | 38 | 10 |
| Total liabilities and shareholders’ equity | 100 | 100 | 100 | 100 |
| Financial Ratios | E | G | M | N |
|---|---|---|---|---|
| Current assets/current liabilities | 1.86 | 10.71 | 0.91 | 1.36 |
| Cash, marketable securities, and accounts receivable/current liabilities | 1.67 | 9.83 | 0.71 | 1.23 |
| Inventory turnover | NA | NA | NA | NA |
| Receivables collection period (days) | 41 | 52 | 7 | 8047 |
| Total debt/total assets | 0.33 | 0.10 | 0.17 | 0.63 |
| Long-term debt/capitalization | 0.70 | 0.11 | 0.29 | 0.56 |
| Revenue/total assets | 1.393 | 0.337 | 0.919 | 0.038 |
| Net profit/revenue | 0.015 | 0.010 | 0.025 | 0.107 |
| Net profit/total assets | 0.021 | 0.004 | 0.023 | 0.004 |
| Total assets/shareholders’ equity | 8.21 | 1.28 | 2.66 | 9.76 |
| Net profit/shareholders’ equity | 0.171 | 0.005 | 0.060 | 0.039 |
| EBIT/interest expense | 3.42 | 10.55 | 4.24 | NA |
| EBITDA/revenue | 0.06 | 0.23 | 0.09 | 0.15 |
What’s it like to run a bank? Banks run a “spread” business where they charge you more for loans than they give you on their deposits. In the process, they take your short-term capital (deposits) and transform it into long-term capital (loans) for the economy. That transformation of short-term capital into long-term capital is why we value banks so greatly and why they sometimes fail. The mismatch between a bank’s assets and liabilities combines with high leverage to create little margin for error.
Nearly every financial crisis begins with questions about asset quality, which lead to outflows of deposits, which must be funded with rapid sales of loans by the banks, which lead to declining loan prices, which lead to an uncontrollable cycle that can result in their destruction.
Capital-intensive service providers
How can we distinguish between the remaining three companies?
Companies E and M have much more property, plant, and equipment than the other companies, including company G. Southwest Airlines and UPS are fundamentally transportation companies, and they both own planes and a lot of equipment. Take a look at the numbers to see how they differ in other respects. (See companies E and M in table 1-10.)
One of the most significant differences between these two companies is that company M gets paid in seven days, on average, which likely means it sells mostly to individuals. In contrast, company E takes considerably longer to collect, which would suggest that it’s much more likely to be selling to other businesses. Southwest Airlines sells to people like you and me, and we pay immediately. UPS, in contrast, does business with other companies as a logistics provider. So company E is likely to be UPS, and company M is Southwest Airlines. Can you find another data point that backs up this hypothesis?
Company E has a lot of other liabilities. What are those long-dated liabilities that UPS owes? These liabilities are pensions and obligations to retirees. It takes some knowledge of these companies to know this, but UPS has one of the largest defined benefit pension plans in the world. Defined benefit pension plans are something that budget airlines avoid, but UPS, an older company that was once owned by employees, has maintained their traditional pensions.
The cash-rich, equity-dependent service company
By the process of elimination, Facebook is company G. But does it conform to what you expect? Company G has a large amount of equity and lots of cash—is that consistent with G being Facebook? Facebook is the youngest company on the list, and it had recently gone public in 2013.
Because values on balance sheets are recorded at the time of the issuance or acquisition (remember that conservatism principle?), high equity numbers can coincide with younger companies. What did it do with all the money that it raised? At the time, it held the money it raised in cash.
As Facebook has matured, its balance sheet has changed. Facebook has since completed a number of large acquisitions, including WhatsApp and Instagram. How would those acquisitions be manifest in their balance sheets? Facebook’s cash levels have come down, and those “other assets” we discussed have risen. Because Facebook bought other companies for much more than their book value (because Facebook valued all those intangible assets that accounting ignores), Facebook’s goodwill accounts would have increased. It paid $19 billion for WhatsApp in 2014, and the book value of WhatsApp was only $51 million. That excess of the purchase price over the book value showed up as goodwill for Facebook.
Retailers
When reviewing the receivables collection period, we saw that the companies were divided between those that collect quickly and those that take considerably longer. What kinds of companies would collect from customers so quickly? Since retailers sell goods directly to consumers, their receivables collection period is going to be short because customers pay immediately via cash or credit. In contrast, businesses that do business with other businesses give credit of a minimum of thirty days.
So the retailers are A, B, H, I, and K. Which companies on the list are retailers that sell directly to consumers? Amazon, Barnes & Noble, Kroger, Walgreens, and Yum! are all retailers. We can exclude Nordstrom here because the chain has its own brand charge card, so its customers, unlike those of the other companies, can take a long time to pay for their purchases. Through its charge card, Nordstrom behaves more like a bank than a retailer.
How can we sort through these five retailers?
If you’ve ever worked at a retail store, you know that it’s all about moving inventory. These five companies differ dramatically in the way that they turn over their inventory. Some turn over inventory really quickly (company H). Others take a long time (for example, company B). (See table 1-11.)
Companies with distinctive inventory turnover
So which company in this group would move inventory really quickly? Company H turns their inventory thirty-two times a year, so they have only eleven days of inventory at any one time. You should hope that this is Yum! and, in fact, it is. The grocery chain also has perishable goods, but given its selection of dry food and canned goods, its turnover will be considerably slower than that of a restaurant chain.
TABLE 1-11 Identifying the retailers
| Balance sheet percentages | A | B | H | I | K |
|---|---|---|---|---|---|
| Assets | |||||
| Cash and marketable securities | 35 | 4 | 9 | 5 | 4 |
| Accounts receivable | 10 | 4 | 3 | 4 | 6 |
| Inventories | 19 | 38 | 3 | 21 | 21 |
| Other current assets | 1 | 9 | 6 | 2 | 1 |
| Plant and equipment (net) | 22 | 16 | 47 | 60 | 36 |
| Other assets | 13 | 29 | 32 | 7 | 32 |
| Total assets | 100 | 100 | 100 | 100 | 100 |
| Liabilities and shareholders’ equity | |||||
| Notes payable | 0 | 0 | 0 | 11 | 4 |
| Accounts payable | 41 | 22 | 8 | 18 | 13 |
| Accrued items | 17 | 15 | 9 | 4 | 5 |
| Other current liabilities | 0 | 9 | 7 | 11 | 4 |
| Long-term debt | 9 | 2 | 33 | 25 | 12 |
| Other liabilities | 7 | 17 | 18 | 13 | 7 |
| Preferred stock | 0 | 15 | 0 | 0 | 0 |
| Shareholders’ equity | 25 | 19 | 25 | 17 | 54 |
| Total liabilities and shareholders’ equity | 100 | 100 | 100 | 100 | 100 |
| Financial ratios | A | B | H | I | K |
|---|---|---|---|---|---|
| Current assets/current liabilities | 1.12 | 1.19 | 0.87 | 0.72 | 1.23 |
| Cash, marketable securities, and accounts receivable/current liabilities | 0.78 | 0.18 | 0.49 | 0.20 | 0.40 |
| Inventory turnover | 7.6 | 3.7 | 31.5 | 14.9 | 7.3 |
| Receivables collection period (days) | 20 | 8 | 8 | 4 | 11 |
| Total debt/total assets | 0.09 | 0.02 | 0.33 | 0.36 | 0.16 |
| Long-term debt/capitalization | 0.27 | 0.06 | 0.57 | 0.59 | 0.18 |
| Revenue/total assets | 1.877 | 1.832 | 1.513 | 3.925 | 2.141 |
| Net profit/revenue | -0.001 | -0.023 | 0.117 | 0.015 | 0.030 |
| Net profit/total assets | -0.001 | -0.042 | 0.177 | 0.061 | 0.064 |
| Total assets/shareholders’ equity | 3.97 | 2.90 | 4.00 | 5.85 | 1.83 |
| Net profit/shareholders’ equity | -0.005 | -0.122 | 0.709 | 0.355 | 0.117 |
| EBIT/interest expense | 7.35 | -6.21 | 13.57 | 5.98 | 35.71 |
| EBITDA/revenue | 0.05 | 0.00 | 0.22 | 0.05 | 0.06 |
At the other extreme, company B turns over inventory really slowly—almost 100 days. Which company has inventory that ages relatively well and takes a long time to move? If you’ve ever been in a bookstore, that should sound familiar. But is there anything else about company B that feels like a bookstore?
Company B is also notable because it’s losing money. Bookstores worldwide are disappearing. Bookselling is a very tough business, given the rise of Amazon, and this shows up as a negative profit margin. And company B is also the only one that had to issue preferred stock, further indicating its troubled financial position.
The final three retailers
The remaining three companies—A, I, and K—differ sharply when it comes to property, plant, and equipment, with company A having the least of that item. We know that two of these companies are brick-and-mortar operations (Walgreens and Kroger), so Amazon, an online marketplace, would have lower property, plant, and equipment, and might be A.
But given Amazon’s position in today’s economy, let’s find the confirming evidence. What else is distinctive about company A that might coincide with what we think about Amazon? First, company A was not making any money. If you’ve followed Amazon, you know that it’s notorious for not making any profits. We’ll explore Amazon further in chapter 2.
The second piece of confirmatory evidence is that company A has a large amount of payables, which could mean that it is in trouble or that it is granted credit easily by suppliers because of its size. Given the amount of cash that company A has, we know they are not in financial trouble. So, company A looks like Amazon, with its strong position in the marketplace and power over its suppliers.
That leaves us with two more: the retail drug chain and grocer for I and K.
One big difference is that company I has considerably more property, plant, and equipment than company K. Think about the last time you were in a grocery store or a drugstore. Which had a lot more equipment? In the grocery business, managing the cold chain is really expensive, so the one with more equipment, I, is probably the grocery store. But let’s look for more clues.
Company I also collects more quickly than company K, further evidence that it’s the grocer because grocery stores are more likely to get immediate payments. A significant fraction of drugstore revenues may come from insurance companies, which would mean drugstores would become a bit like a B2B firm. And company I is turning inventory faster as well, as we would expect for a grocer. So we can conclude that company K is the drugstore Walgreens and company I is Kroger.
The Stragglers
After the retailers and service companies, we’re left with a motley crew—Microsoft, Nordstrom, Duke Energy, Pfizer, and Dell—that are presented in table 1-12.
Three of the companies, C, D, and F, have barely any PP&E, while the remaining two companies have very significant PP&E. One is likely Duke Energy, which has power plants, and the other is likely Nordstrom, a brick-and-mortar retailer. But which is which?
To double-check, look at the three remaining companies and gauge their property, plant, and equipment. Dell, Pfizer, and Microsoft don’t really do any heavy manufacturing so their low levels of PP&E make sense.
Which of the two companies with significant property, plant, and equipment is Duke Energy and which is Nordstrom? The key differentiating factor here is inventory. Nordstrom would have a large amount of inventory, while Duke Energy has very little (electricity can’t be stored). So company L turns out to be Duke Energy, and company J is retailer Nordstrom. Also, the big EBITDA margin for company L means that it is generating a large amount of depreciation and amortization. That’s what utilities do. And often in the utility industry, people talk about EBITDA as opposed to profitability because they know how distorting all that depreciation and amortization can be.
TABLE 1-12 Identifying the stragglers
| Balance sheet percentages | C | D | F | J | L |
|---|---|---|---|---|---|
| Assets | |||||
| Cash and marketable securities | 27 | 25 | 54 | 16 | 2 |
| Accounts receivable | 21 | 7 | 12 | 26 | 2 |
| Inventories | 3 | 4 | 1 | 17 | 3 |
| Other current assets | 8 | 5 | 4 | 4 | 2 |
| Plant and equipment (net) | 4 | 8 | 7 | 32 | 60 |
| Other assets | 37 | 52 | 22 | 5 | 31 |
| Total assets | 100 | 100 | 100 | 100 | 100 |
| Liabilities and shareholders’ equity | |||||
| Notes payable | 8 | 3 | 2 | 0 | 4 |
| Accounts payable | 24 | 2 | 3 | 12 | 2 |
| Accrued items | 8 | 1 | 3 | 5 | 1 |
| Other current liabilities | 9 | 9 | 18 | 10 | 2 |
| Long-term debt | 11 | 17 | 9 | 39 | 32 |
| Other liabilities | 17 | 24 | 9 | 10 | 23 |
| Preferred stock | 0 | 0 | 0 | 0 | 0 |
| Shareholders’ equity | 23 | 44 | 55 | 24 | 36 |
| Total liabilities and shareholders’ equity | 100 | 100 | 100 | 100 | 100 |
| Financial Ratios | C | D | F | J | L |
|---|---|---|---|---|---|
| Current assets/current liabilities | 1.19 | 2.64 | 2.71 | 2.28 | 1.01 |
| Cash, marketable securities, and accounts receivable/current liabilities | 0.97 | 2.07 | 2.53 | 1.53 | 0.45 |
| Inventory turnover | 32.4 | 1.6 | 10.4 | 5.5 | 2.3 |
| Receivables collection period (days) | 63 | 77 | 82 | 64 | 51 |
| Total debt/total assets | 0.19 | 0.20 | 0.11 | 0.39 | 0.36 |
| Long-term debt/capitalization | 0.33 | 0.28 | 0.14 | 0.62 | 0.47 |
| Revenue/total assets | 1.198 | 0.317 | 0.547 | 1.502 | 0.172 |
| Net profit/revenue | 0.042 | 0.247 | 0.281 | 0.061 | 0.090 |
| Net profit/total assets | 0.050 | 0.078 | 0.153 | 0.091 | 0.016 |
| Total assets/shareholders’ equity | 4.44 | 2.27 | 1.80 | 4.23 | 2.77 |
| Net profit/shareholders’ equity | 0.222 | 0.178 | 0.277 | 0.384 | 0.043 |
| EBIT/interest expense | 11.16 | 12.26 | 63.06 | 8.05 | 2.52 |
| EBITDA/revenue | 0.07 | 0.45 | 0.40 | 0.15 | 0.28 |
Of the last three—Dell, Microsoft, and Pfizer—notice that company C has a really low profit margin and companies D and F have really astounding profit margins (greater than 20 percent) and EBITDA margins (greater than 40 percent). Which of the remaining three companies is in the commodifying industry? Over the past ten to fifteen years, the laptop industry has become very commodified, which shows up as depressed profitability. That kind of commodification hasn’t happened in software or in pharmaceuticals.
Also, company C holds on to inventory for only slightly more than ten days, which matches Dell’s just-in-time business model. Dell begins manufacturing only after it takes orders. As a consequence, it keeps inventory as low as possible.
Identifying the Last Two Companies
The two companies left look very much alike, which makes this last step the hardest. One important difference is that company D has a lot of other assets, which means it is probably in an intangible capital–intensive industry that has been consolidating.
If you follow the pharmaceutical industry, you probably suspect that company D is Pfizer. Pfizer has had a long string of acquisitions, from Pharmacia to Wyeth to Hospira, as the entire industry has consolidated. So company D is Pfizer, and company F is Microsoft. Another piece of confirmatory evidence can help us nail this down. You’ll see that company D has considerably more other liabilities than company F. That, too, is consistent with D being Pfizer as it has an old-style pension plan, while Microsoft, as a much younger company, has a defined contribution pension plan. Finally, you may know that Microsoft holds large cash balances, which corresponds to company F.
The Most Important Ratio
After going through all those numbers, is it possible to think of any one number as the most important number of all? Which of those many ratios is the most important for managers to focus on?
This question is controversial, but many financial analysts focus on return on equity (ROE), since that number measures the returns to owners, who are arguably the ultimate bosses within a company. Because ROE is a widely used measure, it’s important to understand the factors that contribute to an ROE. The DuPont framework, a method of analyzing a company’s financial health originated by the DuPont Corporation in the early part of the twentieth century, provides a useful way to understand the levers of ROE.
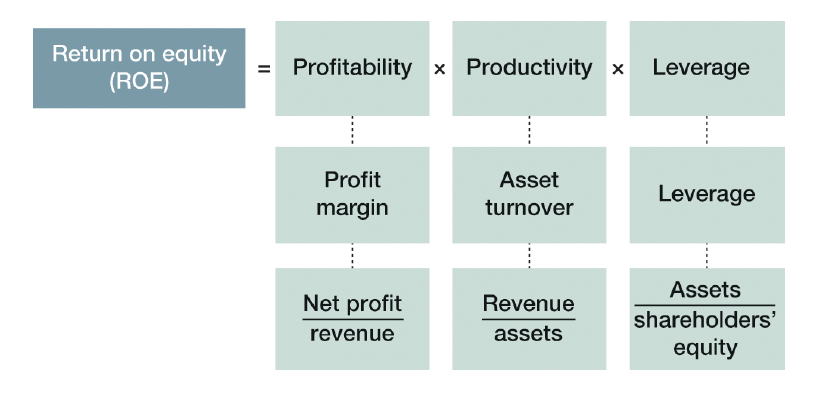
The DuPont Framework
The DuPont framework breaks ROE algebraically into three ingredients: profitability, productivity, and leverage.
- Profitability: The first important contributor to ROE is how profitable a company is. That goes back to the notion of profit margin. For every dollar of revenue, how much does it earn in net profit?
- Productivity: Being profitable is important, but an ROE can be bolstered by productivity as well. To measure a company’s productivity, we use the asset turnover ratio, which measures how efficiently a company can use its assets to generate sales.
- Leverage: As we saw, leverage can magnify returns. It is also an important contributor to ROE. In this setting, we can measure leverage by dividing a company’s assets by its shareholders’ equity.
This simple formula allows you to discover the sources of a high ROE. Like all other measurements, ROE is imperfect, and two problems stand out. First, because it includes the effects of leverage, it does not purely measure operational performance. That’s why some people prefer a return on capital, which compares EBIT to a firm’s capitalization (debt plus equity). Second, as we’ll see later, it does not correspond to the cash-generating capability of a business.
The DuPont Framework in Action
Let’s test our newfound financial intuition by looking at ten very different companies to see how their determinants of ROE differ. (See table 1-13.)
As we look at the ten companies, we’ll try to answer two questions: First, which of the four pieces of the DuPont framework is going to be the most similar across these ten very different companies: ROE, profitability, productivity, or leverage? Second, for each portion of the formula, which companies will have the highest and lowest values?
TABLE 1-13 DuPont analysis
ROEs and levers of performance for 10 diverse companies, 1998
| Company | ROE (%) | = | Profit Margin (%) | x | Asset Turnover (times) | x | Financial Leverage (times) |
|---|---|---|---|---|---|---|---|
| Bank of America Corporation | = | × | × | ||||
| Carolina Power and Light | = | × | × | ||||
| Exxon Corporation | = | × | × | ||||
| Food Lion, Inc. | = | × | × | ||||
| Harley-Davidson, Inc. | = | × | × | ||||
| Intel Corporation | = | × | × | ||||
| Nike, Inc. | = | × | × | ||||
| Southwest Airlines Co. | = | × | × | ||||
| Tiffany and Company | = | × | × | ||||
| The Timberland Company | = | × | × |
For the first question, try to think about why these numbers might be different and what might drive them together. For the second question, try to think through what each piece of the DuPont framework represents conceptually.
The answer to the first question is ROE. The range of ROEs in table 1-14 is much narrower than the range of values in the remaining three columns (just compare the highest to the lowest). So why is ROE the most similar across all the companies?
While these companies don’t compete in product markets, they all compete in capital markets. Consequently, the rewards to shareholders can’t deviate too far from each other because capital will be driven away from low performers and toward better performers. That’s why ROEs look most similar.
Should all the ROEs look the same? No, because of the relationship between return and risk (we’ll do much more on this in chapter 4). If shareholders bear more risk, they’re going to demand a higher return. So capital markets and the competition across companies drive returns to shareholders together and risk drives them apart.
Let’s examine some of the highs and lows of the different columns, starting with profitability. Profitability for Food Lion is quite low, 2.7 percent. For Intel, it’s remarkably high. Why?
While you might be tempted to attribute these gaps to different levels of competition, the reality is that all these companies operate in a competitive world. In fact, profitability measures a company’s value addition and varies with the amount of that value addition. Food retailers just don’t add much value, so even the very best food retailers get margins of only 4 percent. In contrast, think about Intel. It takes sand and makes it into computers. That’s real value added. So profitability is going to reflect that underlying process of value addition.
Why is Food Lion the highest on asset turnover? What’s it like to run a grocery store? It doesn’t make money on every box of cereal sold. The whole game is turning over those inventories as quickly as possible. That’s why asset turnover is the most important factor in achieving ROE for food retailers.
Finally, as discussed, leverage is a critical tool in finance. Which companies have high or low leverage? The bank is highest, but it is also exceptional in its business, so let’s consider the remaining companies.
TABLE 1-14 DuPont analysis
ROEs and levers of performance for 10 diverse companies, 1998
| Company | ROE (%) | Profit Margin (%) | Asset Turnover (times) | Financial Leverage (times) |
|---|---|---|---|---|
| Bank of America Corporation | 11.2 | 10.8 | 0.1 | 13.5 |
| Carolina Power and Light | 13.5 | 12.8 | 0.4 | 2.8 |
| Exxon Corporation | 14.6 | 6.3 | 1.1 | 2.1 |
| Food Lion, Inc. | 17.0 | 2.7 | 2.8 | 2.3 |
| Harley-Davidson, Inc. | 20.7 | 9.9 | 1.1 | 1.9 |
| Intel Corporation | 26.0 | 23.1 | 0.8 | 1.3 |
| Nike, Inc. | 12.3 | 4.2 | 1.8 | 1.7 |
| Southwest Airlines Co. | 18.1 | 10.4 | 0.9 | 2.0 |
| Tiffany and Company | 17.4 | 7.7 | 1.1 | 2.0 |
| The Timberland Company | 22.2 | 6.9 | 1.8 | 1.8 |
Of the remaining companies, which has the highest leverage and the lowest leverage? Carolina Power & Light has the highest leverage, and Intel has the lowest. Why? Varying levels of leverage reflect the amount of business risk because it is unwise to pile financial risk on top of business risk. Carolina Power and Light has stable demand, and its pricing is likely regulated, so its cash flows are steady. Accordingly, it can sustain higher amounts of leverage.
In contrast, a business that is very high risk, like Intel, should not carry large amounts of leverage. Think about what Intel does. It creates a new chip every two years that does twice as much in half as much space at half the cost. And it builds new plants around the world that cost billions of dollars to build the next generation of chips. If it gets one new version wrong, it can go out of business. With high business risk, there should be low financial risk. That’s the pattern we see in leverage more generally.
So far, we’ve looked at how ratios differ across industries. But the best way to use financial analysis is to look at one company over time relative to its industry. We’ll zoom in on one company from the DuPont analysis, Timberland, and try to tell a story with the numbers.
TABLE 1-15 DuPont analysis for Timberland Company, 1994
Ratio analysis of Timberland Company, 1994, and industry median
| Ratio Type | Timberland Company 1994 | Industry average* |
|---|---|---|
| Profitability ratios (%) | ||
| Return on equity (%) | 11.9 | 12.3 |
| Return on invested capital (%) | 7.1 | 9.7 |
| Profit margin (%) | 2.8 | 4.2 |
| Gross margin (%) | 35.0 | 38.4 |
| Turnover ratios | ||
| Asset turnover | 1.3 | 1.8 |
| Inventory turnover | 1.9 | 2.7 |
| Collection period (days) | 73.5 | 39.1 |
| Payable period (days) | 32.6 | 36.3 |
| Leverage and liquidity ratios | ||
| Assets to equity | 3.2 | 1.7 |
| Debt to assets (%) | 68.5 | 39.6 |
| Times interest earned | 2.9 | 9.1 |
| Current ratio | 3.5 | 3.0 |
*Sample consists of five representative shoe companies: Brown Group, Kenneth Cole, Nike, Stride Rite, and Wolverine World Wide.
Profound Changes at Timberland
Timberland, a manufacturer and retailer of rugged outdoor wear, went through some profound financial and structural changes during the 1990s. Let’s look at it in 1994, relative to its industry. (See table 1-15.)
The elements of the DuPont framework—ROE, profitability, productivity, and leverage measures—are in italics in the table. Look at these numbers and come up with as many conclusions as you can. Try to tell a story by comparing Timberland to its industry.
First, how is Timberland doing? If I were the CEO, I would emphasize that the ROE, 11.9 percent, is pretty much the industry average of 12.3 percent, so I would conclude that the company is doing great. Would you agree?
When we do a DuPont analysis, however, a different story emerges. Where is all that ROE coming from? From profitability? No, Timberland is underperforming on profitability. From productivity? No, it’s underperforming there as well.
Timberland’s ROE is coming largely from leverage. Since its ROE comes from leverage, that means it’s overcoming poor operational performance by making its owners bear more risk.
This is one of the major problems with ROE. As valuable as it is, leverage has a way of infecting the final calculation. That’s why some people turn to slightly different measures, like return on assets and return on capital. These measures take out the confounding influences of leverage and show that managers at Timberland deploy capital less efficiently than their peers.
Return on capital (ROC), also known as return on invested capital or return on capital employed, is a particularly important measure, as it considers both capital providers and their combined return. What is their combined return? The return to capital providers is all operating income (or EBIT) after taxes, also known as EBIAT.
Other numbers also alert us to Timberland’s underperformance. Look at its interest coverage or “times interest earned” number, which measures how many times it can cover its interest payments with its operating earnings. It is less than three, while for the rest of the industry, it’s close to ten. What does that mean? The company is walking a financial tightrope that its competitors have chosen to avoid.
Let’s look at Timberland’s operations. Its inventory turnover is considerably lower than the rest of the industry. Second, its receivables collection period is really out of whack with the rest of the industry (73.5 versus 39.1). There could be a few causes of this long collection period. The first is bad management that is not being aggressive about collecting the cash owed to the company. Alternatively, it could be imprudently generous with credit to stimulate sales. More dangerously, Timberland could have customers with outstanding debts that have been outstanding for more than two hundred days, with little likelihood of ever paying them. So it might be a sign of hidden bad debt. Its payables period, how long it takes to pay suppliers, is similar to the rest of the industry.
The Numbers, a Year Later
Let’s look at Timberland’s numbers in 1995. (See table 1-16.)
TABLE 1-16 DuPont analysis for Timberland Company, 1994–1995
Ratio analysis of Timberland Company, 1994–1995, and industry median, 1998
| Ratio Type | 1994 | 1995 | Industry median* |
|---|---|---|---|
| Profitability ratios (%) | |||
| Return on equity (%) | 11.9 | -8.2 | 12.3 |
| Return on invested capital (%) | 7.1 | 0.7 | 9.7 |
| Profit margin (%) | 2.8 | -1.8 | 4.2 |
| Gross margin (%) | 35.0 | 33.7 | 38.4 |
| Turnover ratios | |||
| Asset turnover | 1.3 | 1.6 | 1.8 |
| Inventory turnover | 1.9 | 2.4 | 2.7 |
| Collection period (days) | 73.5 | 53.4 | 39.1 |
| Payable period (days) | 32.6 | 21.2 | 36.3 |
| Leverage and liquidity ratios | |||
| Assets to equity | 3.2 | 3.0 | 1.7 |
| Debt to assets (%) | 68.5 | 66.2 | 39.6 |
| Times interest earned | 2.9 | 0.2 | 9.1 |
| Current ratio | 3.5 | 4.8 | 3.0 |
*Sample consists of five representative shoe companies: Brown Group, Kenneth Cole, Nike, Stride Rite, and Wolverine World Wide.
For the DuPont analysis, the ROE is negative, which is driven by negative profitability. Productivity is up a little, and leverage is down a little.
Digging deeper, what do those leverage numbers tell us? The times interest earned number went from over three to under one. That means that Timberland didn’t have enough operating profit to pay its interest. This was a near-death situation for Timberland. What should Timberland do in this dire situation? Timberland needed to raise more cash, and from the numbers, we can tell that’s exactly what it did.
First, inventory turnover increased markedly, while gross margins dipped significantly. That pattern indicates a fire sale of sorts. It liquidated goods as fast as it could to raise cash to make its interest payments. Similarly, look at its receivables collection period—it dropped by twenty days. That didn’t happen accidentally. Another way to raise cash is to contact the customers that owe money and ask them for, say, $0.80 on the dollar. In short, the company needed the cash and was willing to make deals because it needed to raise cash to make interest payments.
The final piece of working capital, in addition to inventory and receivables, is Timberland’s payables, which were in good shape the previous year. Now, it’s paying its suppliers more quickly, which may seem odd fora company that’s strapped for cash. But the shrinking payables periodwas most likely directed by its suppliers, who, given Timberland’s finan-cial situation, were unlikely to extend credit. Instead, they may have demanded cash on delivery. The effects of working capital on cash will be amajor theme in chapter 2.
The Numbers from 1994 to 1998
Now look at the numbers for the next few years. (See table 1-17.)
TABLE 1-17 DuPont analysis for Timberland Company, 1994–1998
Ratio analysis of Timberland Company, 1994–1998, and industry median, 1998
| Ratio Type | 1994 | 1995 | 1996 | 1997 | 1998 | Industry median* |
|---|---|---|---|---|---|---|
| Profitability ratios (%) | ||||||
| Return on equity (%) | 11.9 | -8.2 | 12.3 | 22.1 | 22.2 | 12.3 |
| Return on invested capital (%) | 7.1 | 0.7 | 9.6 | 18.3 | 17.9 | 9.7 |
| Profit margin (%) | 2.8 | -1.8 | 3.0 | 5.9 | 6.9 | 4.2 |
| Gross margin (%) | 35.0 | 33.7 | 39.4 | 41.7 | 41.9 | 38.4 |
| Turnover ratios | ||||||
| Asset turnover | 1.3 | 1.6 | 1.5 | 1.9 | 1.8 | 1.8 |
| Inventory turnover | 1.9 | 2.4 | 2.6 | 3.3 | 3.8 | 2.7 |
| Collection period (days) | 73.5 | 53.4 | 53.2 | 34.7 | 33.4 | 39.1 |
| Payable period (days) | 32.6 | 21.2 | 18.6 | 16.0 | 18.9 | 36.3 |
| Leverage and liquidity ratios | ||||||
| Assets to equity | 3.2 | 3.0 | 2.7 | 2.0 | 1.8 | 1.7 |
| Debt to assets (%) | 68.5 | 66.2 | 63.2 | 48.8 | 43.3 | 39.6 |
| Times interest earned | 2.9 | 0.2 | 2.5 | 5.6 | 10.2 | 9.1 |
| Current ratio | 3.5 | 4.8 | 3.7 | 3.5 | 4.0 | 3.0 |
*Sample consists of five representative shoe companies: Brown Group, Kenneth Cole, Nike, Stride Rite, and Wolverine World Wide.
It looks like things stabilized and turned around remarkably in 1996. Timberland’s profitability was still slightly lower than the industry average, but its productivity was improving and its leverage was coming down. Timberland was moving more inventory, and not by cutting prices. If anything, its gross margin indicates that it was getting pricing power just as it was moving more goods.
In 1997, things were even better. The headline number is quite remarkable as its ROE was almost twice the average for the industry. And it was getting it from all the right places. It was turning over inventory almost twice as much as it was in 1994 and it was raising prices, as reflected by its gross margin.
The upward trend continued in 1998. Timberland was still achieving ROEs that were twice the industry average, but now the ROE was coming entirely from exactly the right places. ROE was not coming from leverage or productivity. It was coming from profitability. So what happened? That near-death experience prompted a move away from family management and toward professional management. That change accompanied Timberland becoming the chosen brand for hip-hop artists, which led to the remarkable turnaround in financial performance.
What did you learn from this exercise? You can use the financial ratios and numbers to tell a story about any company over time. You can play detective and create a narrative so these numbers make some sense. The numbers are available for all kinds of public companies and are readily accessible. I encourage you to use what we just learned to analyze any ofyour favorite companies.
Real-World Perspectives
Laurence Debroux, CFO of Heineken, commented on the most important thing students learning finance can do:
“If you would have asked me twenty years ago about the most important trait for succeeding in finance, I would probably have told you to be hardworking and to be super-expert and driven. That actually leads you to a certain point, but after that it fails you. You can always be hardworking. But now, being persistent and curious are probably the two things I consider most important. Persistence is key, because you can’t take the first answer as a final answer. Finance is about digging, trying to find what is behind the numbers, and what is going on with the assumptions. Is the number right, and if it’s not, why not? Is it showing you reality or distorting it? Numbers are very dry if you just look at them like numbers, but if you want to know the reality behind them, that’s where it starts being interesting. If you’re interested and curious about what people do, then they become interested in what you want to bring.”
Quiz
To further explore and apply your understanding of financial concepts, here are some questions:
-
Increased leverage allows companies to control more assets and increase their ROE. What’s bad about leverage?
- It reduces productivity, which can decrease overall ROE.
- Leverage-based profits are not cash-based and are ignored by finance.
- Leverage multiplies losses, too, as it increases a company’s risk.
- There is nothing bad about leverage—using other people’s money is a good way to increase the value of the company.
-
What types of companies are more likely to have high leverage?
- Companies with high growth opportunities in new industries
- Companies in stable, predictable industries with reliable cash flows
- Technology companies
- Companies with low profitability
-
In 2009, Warren Buffett invested $3 billion in Dow Chemical, via an issuance of preferred stock. Which of the following is not an advantage of preferred stock to the owner of the preferred stock?
- In the case of bankruptcy, preferred stockholders get paid before common stockholders.
- Even when common stockholders get no dividends, preferred stockholders may get dividends.
- Preferred stock is associated with ownership in the company, unlike debt.
- Preferred stock dividends must be in even-numbered percentages (2 percent, 4 percent, etc.).
-
Which of the following is least likely to be listed as an asset on a balance sheet?
- Gilead Sciences Inc.’s patent for the highly profitable hepatitis C treatment it developed in-house
- Google’s corporate headquarters
- Payments owed to Ford Motor Company by dealerships for the purchase of cars
- The $42 billion in Facebook’s bank accounts at year-end 2017
-
Which of the following companies is most likely to have the highest inventory turnover?
- Subway, a fast-food restaurant company
- Books-A-Million, a bookstore chain
- Whole Foods, a grocery store
- British Airways, an airline
-
Which ratio is a distinguishing feature of retail companies?
- High ROE
- Low receivables collection period
- High inventory turnover
- High total debt/total assets
-
BHP Billiton is one of the world’s largest mining companies, and accounts receivable make up 21 percent of its total assets (in 2016). Which of the following companies is most likely to owe BHP Billiton money as part of BHP Billiton’s accounts receivable?
- Bank of America, a global bank
- Mining Recruitment Agency, a recruiter for employees specialized in mining
- Sysco, a food distributor
- United States Steel Corporation, a steel manufacturer
-
Which of the following constituencies care most about a company’s current ratio?
- Its stockholders
- Its suppliers
- Its competitors
- Its customers
-
True or false: a high ROE is always a good thing.
- True
- False
-
Home Depot, a home improvement supply store, issued $2 billion in debt in late 2016. What is the main difference between debt and other liabilities, like accounts payable?
- Debt carries an explicit interest rate.
- Debt represents ownership in the company.
- Debt is a residual claim.
- Debt is only owed to suppliers.
Chapter Summary
As I hope you’ve seen, financial analysis is about much more than just the numbers, which are simply tools to help us understand what drives performance across time, across companies, and across industries. Each number is helpful, but no one number tells the whole story. Indeed, each has limitations. Only by piecing together a story from these numbers can we truly understand a company. The process of financial analysis will become easier and more rewarding as you invest more time in it. Ideally, you should walk someone else through the unidentified industries exercise to test whether you understand the material.
I hope you feel that you’ve built a solid foundation of financial literacy. Much of it is very intuitive and involves telling a story with numbers. Next, we’re going to think deeply about cash and why the future matters more than the past or present. If you can, try to use some of the tools from this chapter to look at your company’s—or any company’s—financials.